David McCandless: The beauty of data visualization | Video on TED.com
David McCandless: The beauty of data visualization | Video on TED.com
Reply
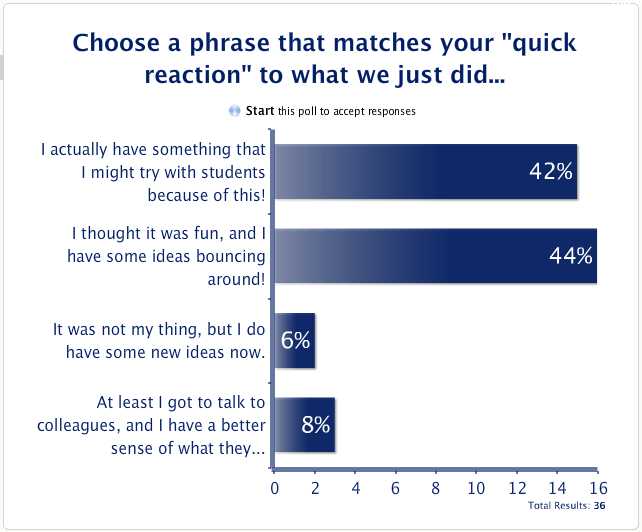
On August 12, the JH Faculty took the next step in the “Build Something Together” Project. The essence of the meeting involved a facilitated exchange of ideas that could grow and morph into realized project-based learning plans. At the conclusion of the meeting, we used Poll Everywhere to establish a quick snapshot of people’s reactions to the meeting.
What would it take to encourage us to clean up after ourselves at lunch?
On Wednesday, August 18, 2010, Mrs. Gough and I embarked on an exciting adventure with twenty-four eighth-grade students. We are piloting a new course entitled Synergy 8. For now, I will resist defining the course because the students are constructing their collective definition in the first few days.
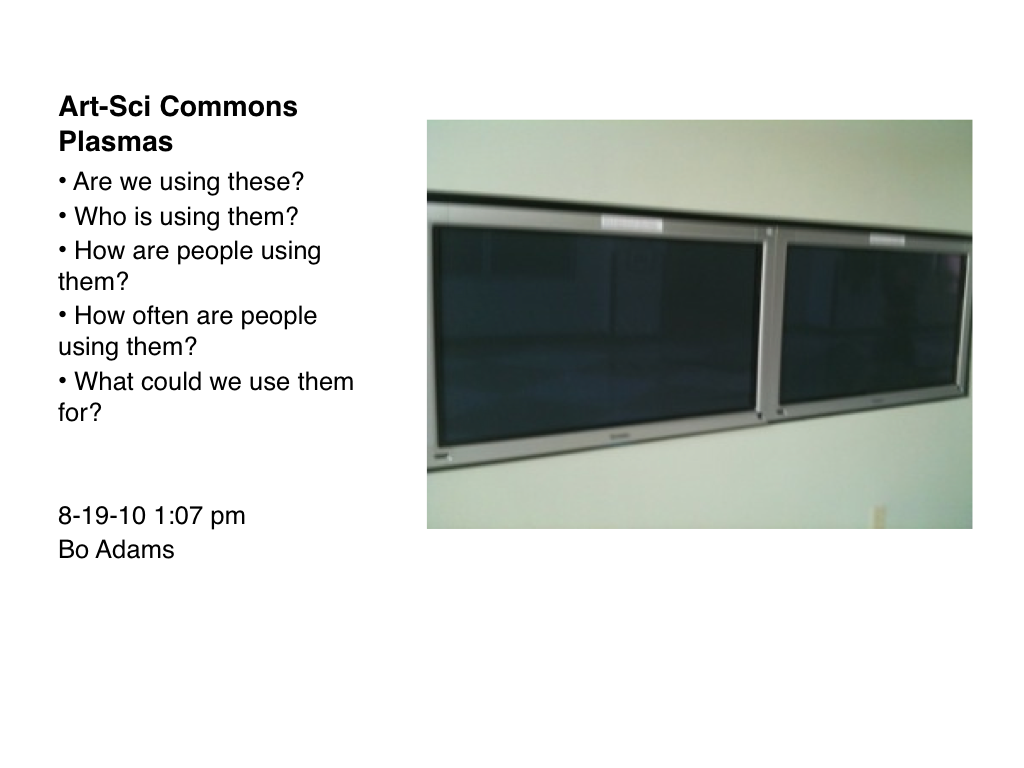
As part of the course, we will all keep “observation journals” or “observation logs.” In the logs, we are simply and succinctly recording observations in our community. Different people are using different methods. Over time, we will discuss our methods, our observations, and our questions that arise from the observations. The picture here, actually a Power Point slide, was originated with my iPhone. After snapping the picture, I emailed the image to myself, inserted the image into a PPT slide and jotted a few questions. Finally, I recorded the date, time, and observer.
